Executive Dashboard
Executive Dashboard
Client: Northfield Dynamics Inc (Fictional)
Overview
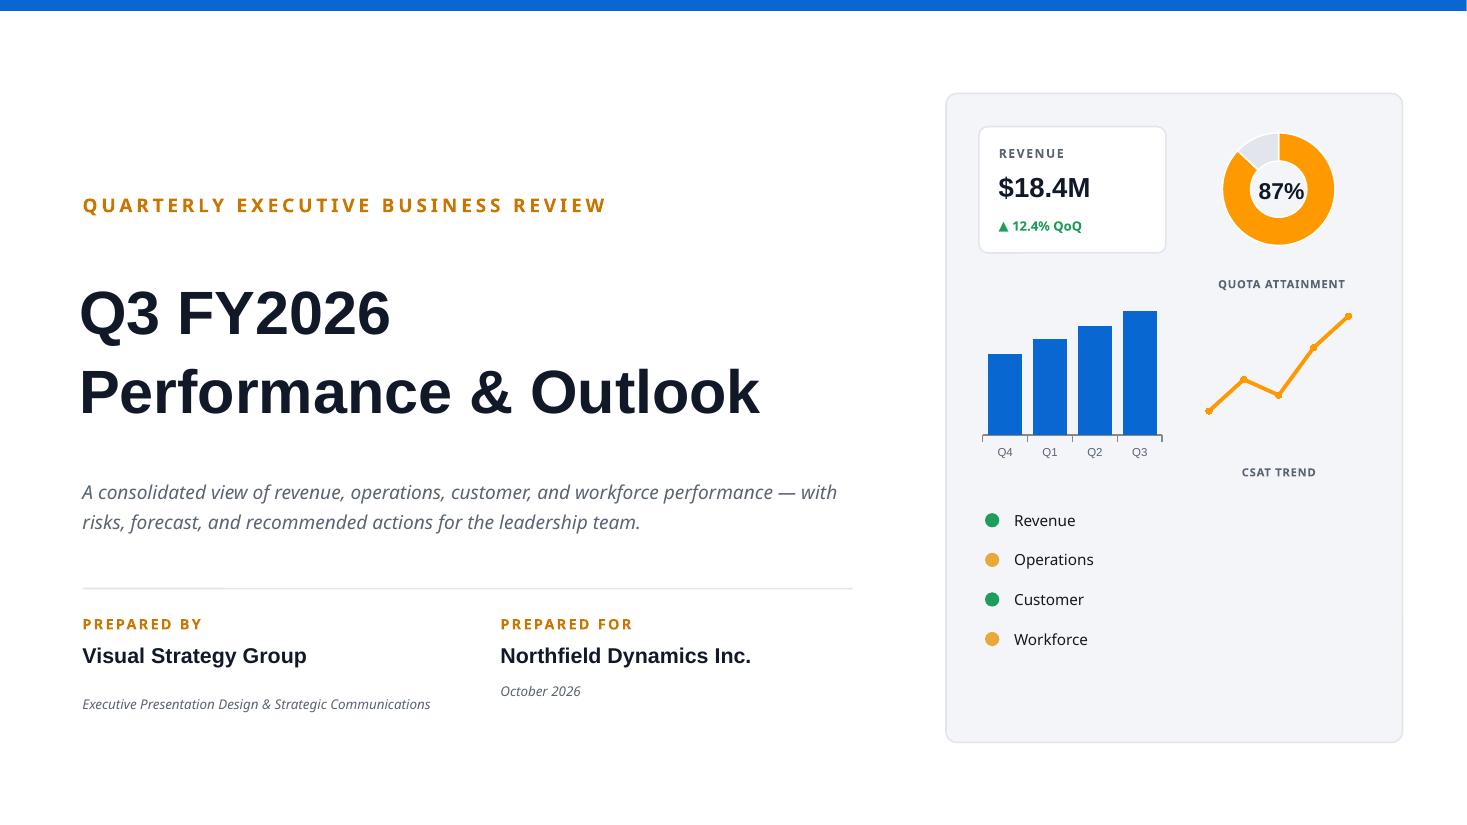
Northfield Dynamics needed a 20-slide board briefing consolidating revenue, operations, customer, workforce, and risk performance into one Q3 FY2026 review with a clear forecast and recommended actions.
Challenge
Each function arrived with its own reporting format, so leadership spent the meeting decoding charts instead of debating performance, and the quarter's single board ask was buried behind dozens of metrics.
Approach
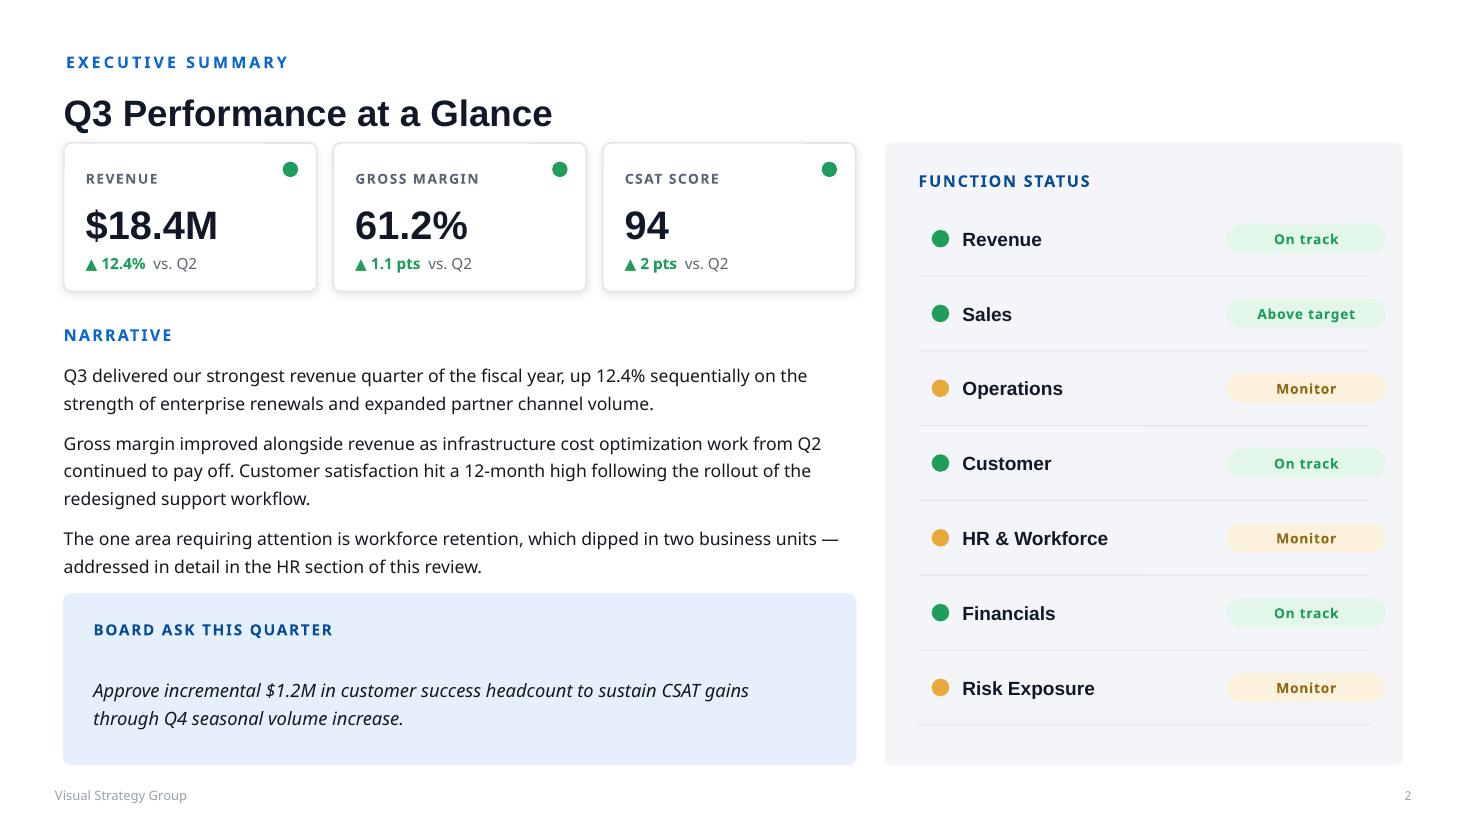
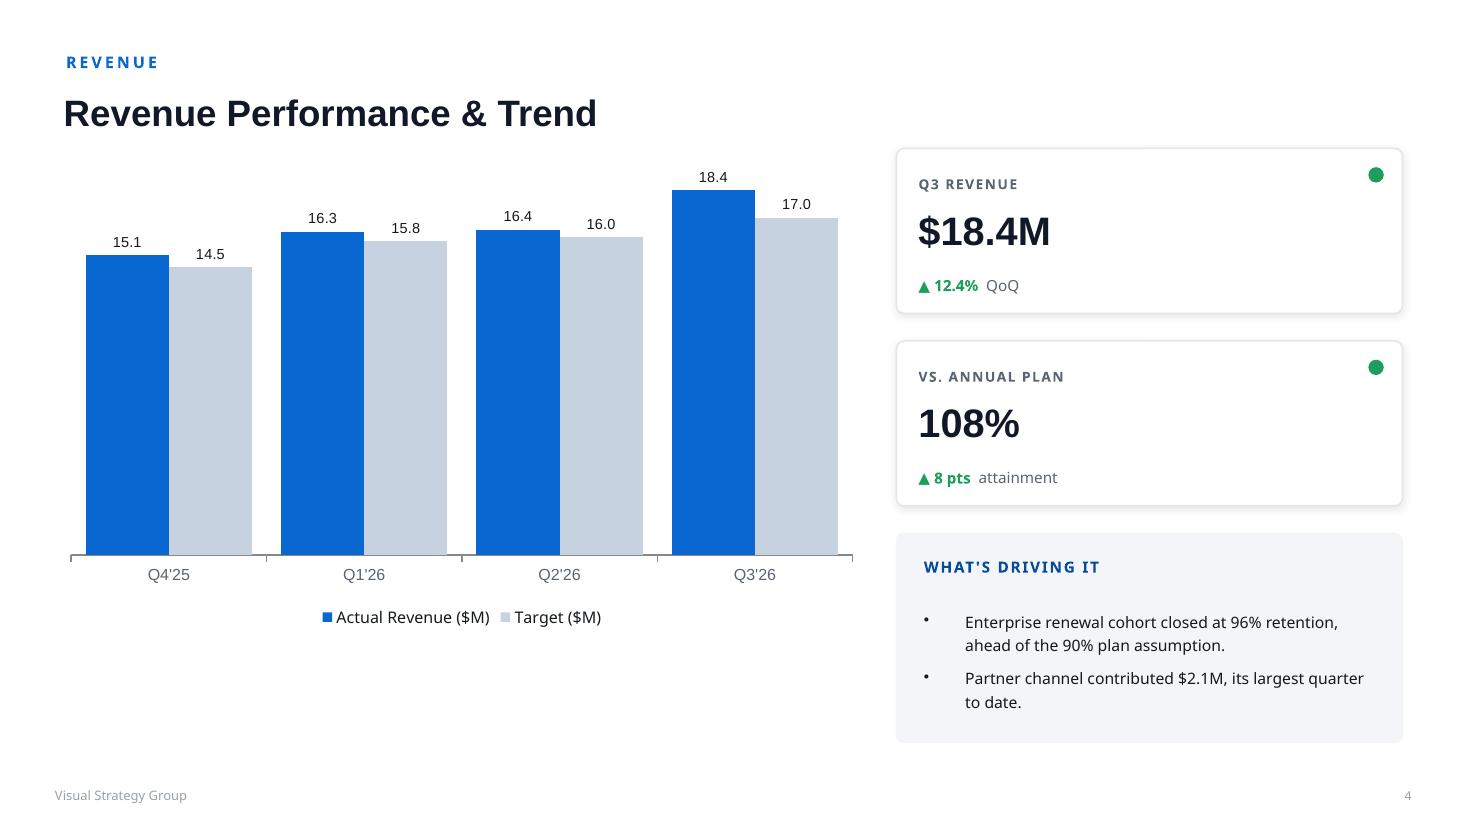
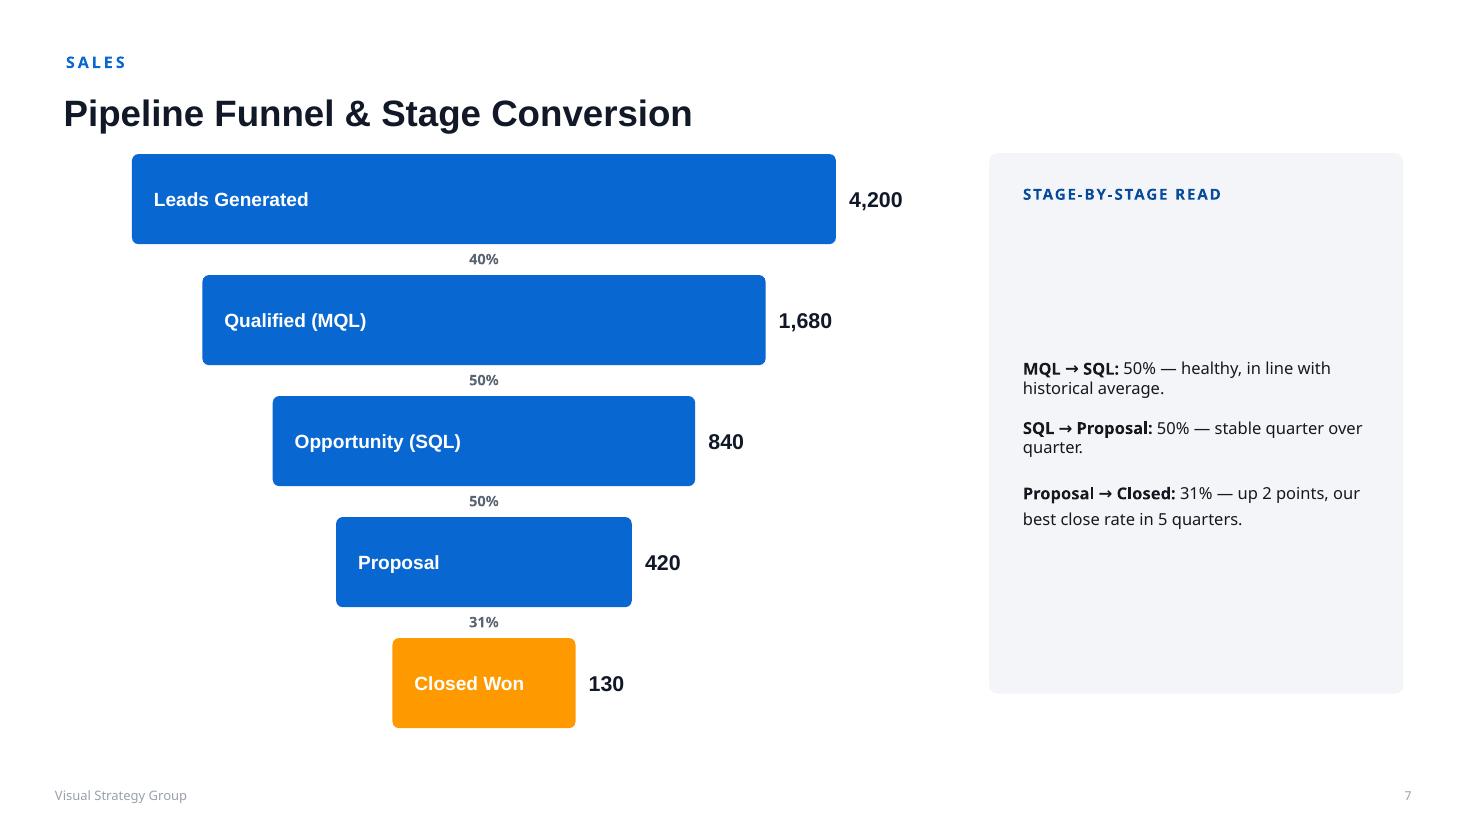
We built a dashboard language for the whole deck: KPI tiles with consistent variance logic, a function-level RAG scorecard, and native, editable chart objects, then sequenced the story from executive summary to scorecard, function deep dives, risk, forecast, and the recommended actions.
Slide gallery
Related projects
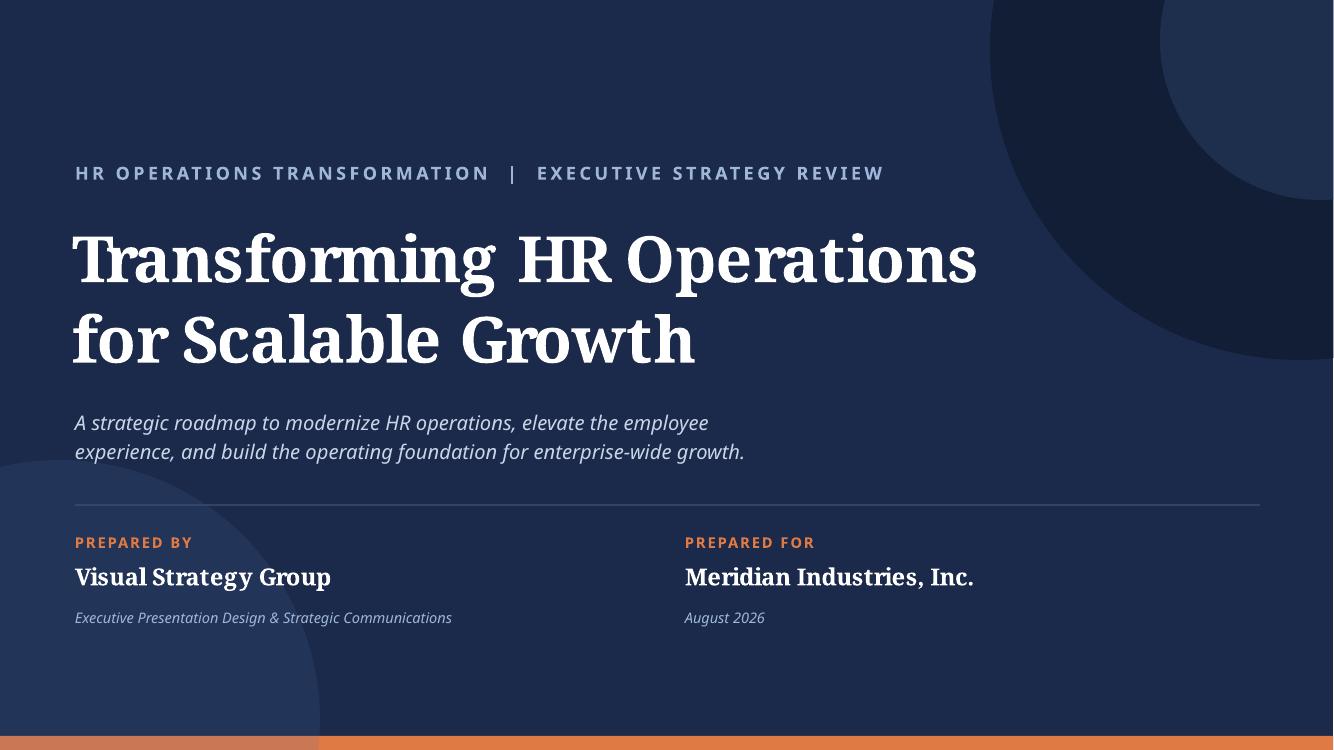
HR Transformation Strategy
A 20-slide executive presentation framing an 18-month people operations transformation.
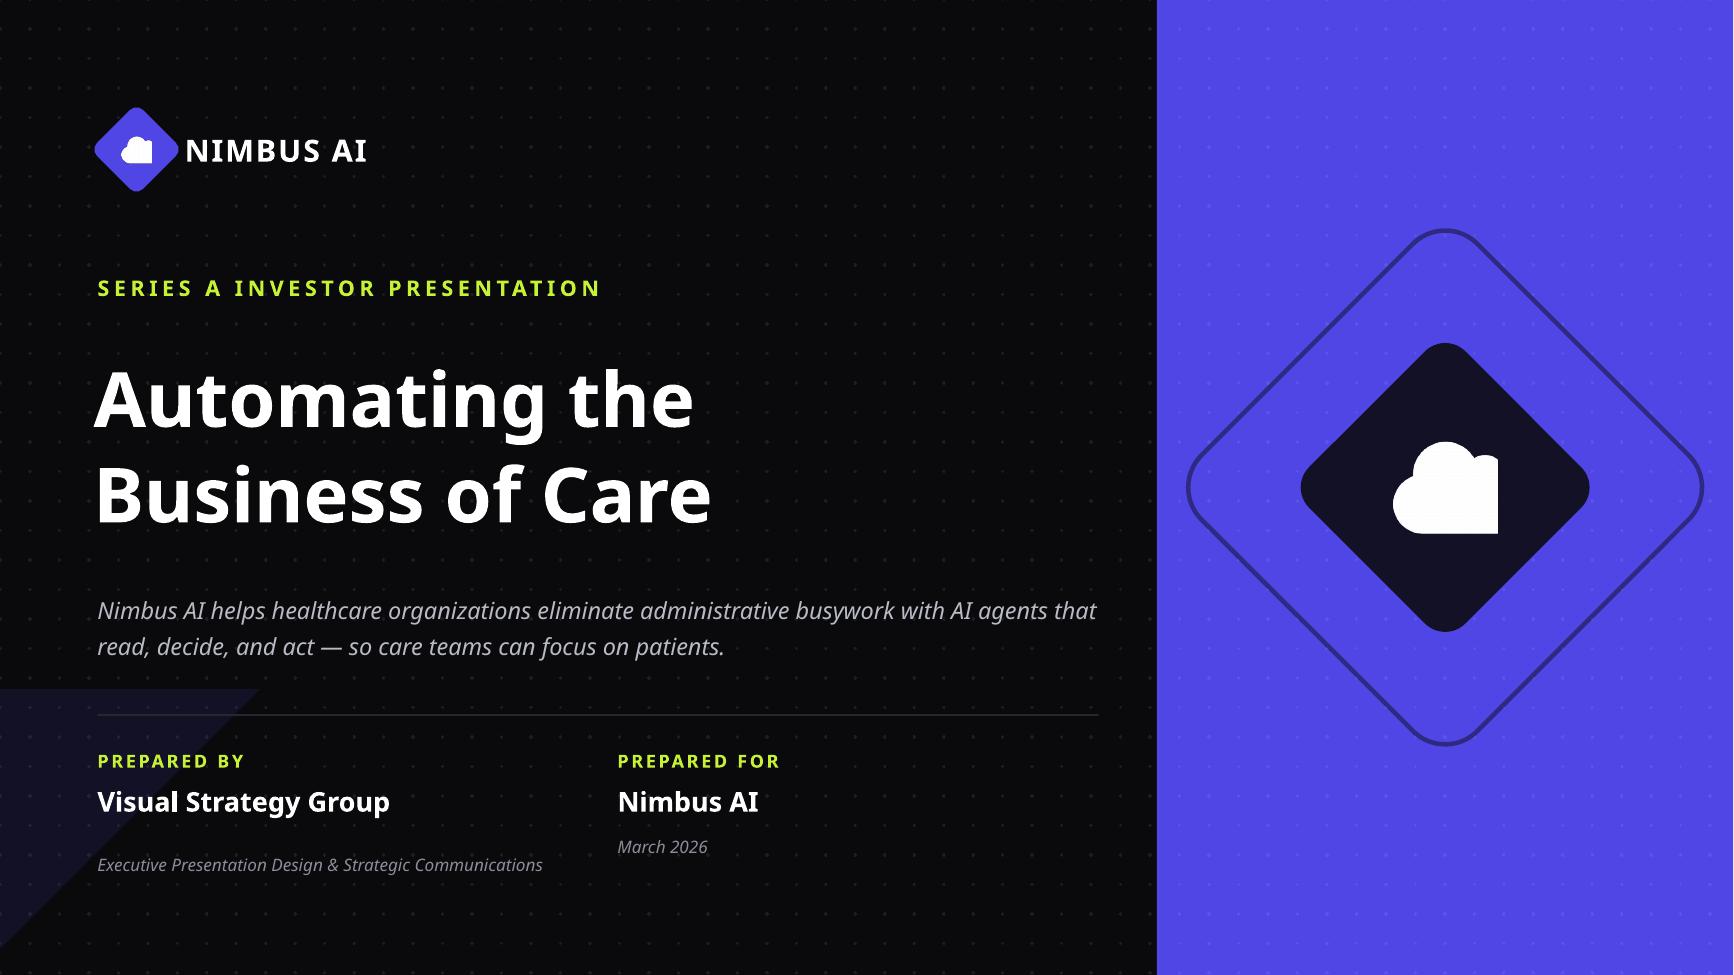
Startup Investor Pitch
A 15-slide Series A pitch deck built around problem, product, market, traction, and the ask.
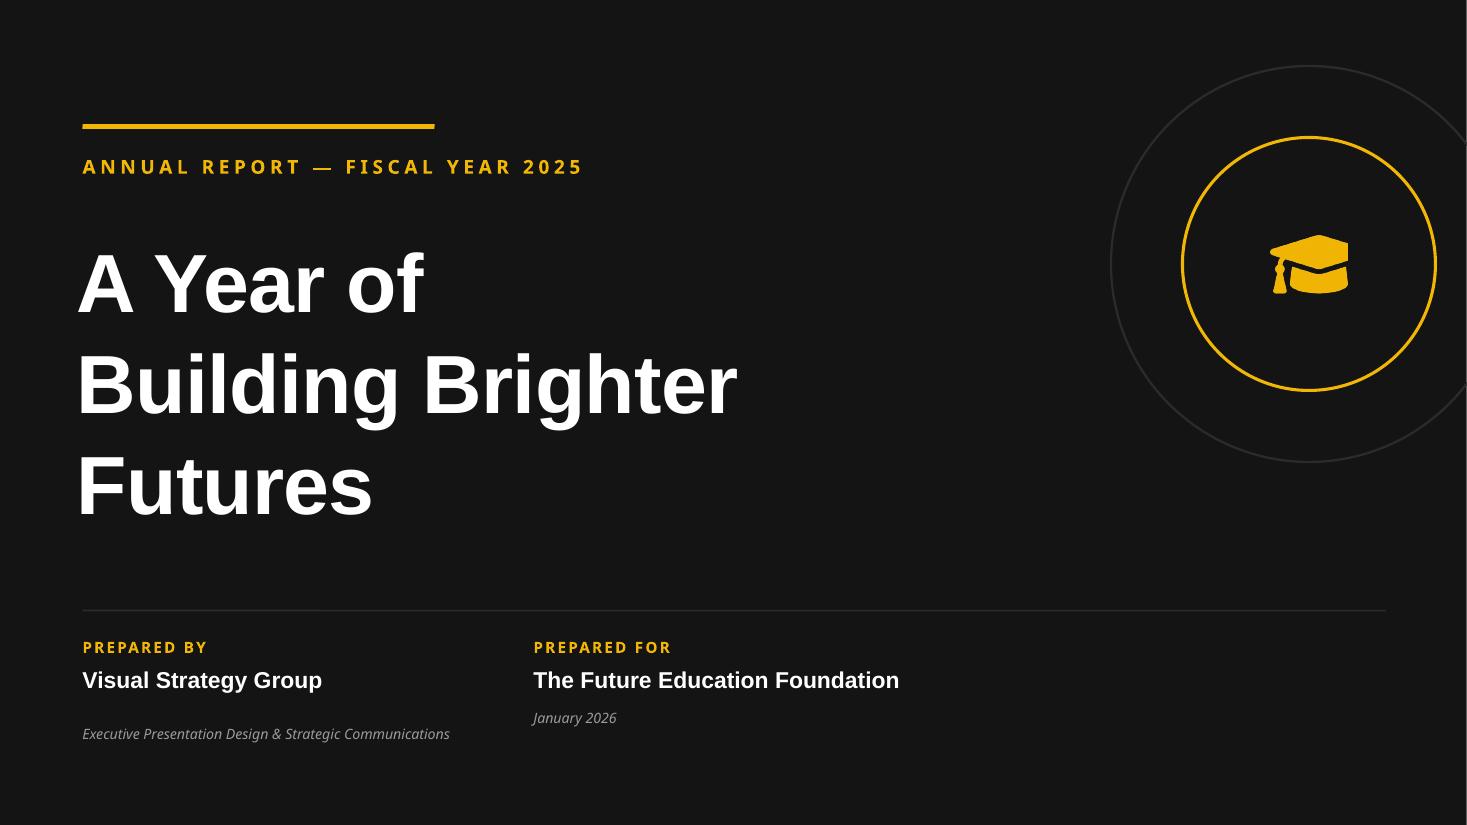
Nonprofit Annual Report
A 22-slide board briefing deck presenting the fiscal year in impact, financials, and forward strategy.
Let's create your next presentation.
Share your audience, your deadline, and what the meeting needs to accomplish.
Start your project